OpenTelemetry Configuration
1. Overview
EMS services emit traces, metrics, and (via Logback appender) correlated logs to a central OpenTelemetry Collector running in the cluster’s observability namespace. The collector forwards to the in-cluster Grafana stack: Tempo for traces and Loki for logs, queried through Grafana in the same namespace. For how to query them — sign-in, datasources, LogQL, dashboards and alerts — see Observability Access.
Pod logs reach Loki by a second, independent path: a Grafana Alloy DaemonSet tails /var/log/pods on each node and writes to Loki directly, without passing through the collector. This is worth knowing because it collects stdout and stderr only — a container that writes its real log to a file inside its own filesystem is invisible to it. See Dependency Update Checks for how that bit us on the SSH bastion.
|
The previous ELK/Kibana backend is deprecated. Loki retains for 720h (30 days). Any document still describing Elasticsearch or Kibana as the logging destination is out of date. |
Two instrumentation paths:
-
Java agent (
opentelemetry-javaagent) — auto-instruments HTTP servers, JDBC, Hazelcast, Kafka, etc. at bytecode level. Baked into the service’s Docker image via Jib’sextraDirectories. -
SDK / starter (
opentelemetry-spring-boot-starter) — enables manual@WithSpanannotations,@Counted,@Timedmethod-level instrumentation, and custom span creation viaTracer.
Both are active simultaneously in admin-service. Spring Web auto-instrumentation is disabled in admin-service’s application-otlp.yml — the agent would double-count if Spring Web also reported. Manual spans and JDBC spans cover the rest.
See also: SpringApplication Bootstrap, Hazelcast Configuration.
2. Topology
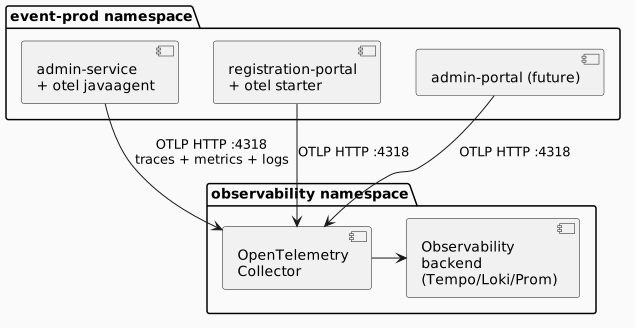
Collector endpoint in-cluster: http://opentelemetry-collector.observability.svc.cluster.local:4318. The collector also listens on :4317 for gRPC, but EMS services must use 4318 — see OTLP transport below. Deployed via ~/dev/idl-xnl-jhb-rc01/argocd/opentelemetry-collector.yml.
3. Admin-Service Configuration
Full detail — this is the reference implementation.
3.1. Profile-gated
Active only when otlp profile is enabled. ArgoCD prod manifest sets config.profiles: "prod,kubernetes,otlp" (or similar — see ArgoCD Deployment Patterns).
3.2. POM configuration
The agent is always baked into the image (regardless of which Spring profile is active); the otlp profile only adds the Spring-side dependencies that activate application-otlp.yml.
In the main <build> section (always runs):
-
Maven plugin:
maven-dependency-plugincopyexecution, bound to thepackagephase. Downloadsio.opentelemetry.javaagent:opentelemetry-javaagent:<version>into${agent-extraction-root}(=${project.build.directory}/jib-agents) as${opentelemetry-javaagent-filename}(=opentelemetry-javaagent.jar). -
Jib
<extraDirectories>then copies that directory into the image at${agent-install-location}(=/javaagent). The image always has/javaagent/opentelemetry-javaagent.jarregardless of profile. -
Jib
<jvmFlags>always include-javaagent:/javaagent/opentelemetry-javaagent.jarplus-Dotel.{logs,traces,metrics}.exporter=otlp. -
Jib
<environment>setsOTEL_SERVICE_NAME=${project.artifactId}so traces are tagged with the service name.
Under the otlp profile (Spring-side only):
-
BOM:
io.opentelemetry.instrumentation:opentelemetry-instrumentation-bom:<version> -
Dependency:
io.opentelemetry.instrumentation:opentelemetry-spring-boot-starter -
Dependency:
io.opentelemetry.instrumentation:opentelemetry-instrumentation-annotations -
Dependency:
io.opentelemetry.instrumentation:opentelemetry-logback-appender-1.0:<version>-alpha
The agent operates at bytecode level and works without any Spring-side dependency. The Spring starter adds @WithSpan annotation support, the logback appender for trace correlation, and SDK-level autoconfiguration. With the otlp profile inactive, the agent is still loaded but it falls back to its own auto-instrumentation only — no Spring @WithSpan, no logback trace correlation.
Anti-pattern (do not copy from older internal scaffolds): downloading the agent into src/main/jib/opt/otel/ with Jib <extraDirectories> pointing at a different path. The path mismatch silently drops the agent from the image; the JVM emits -javaagent: file not found on startup and OTel emits nothing. Source-tree pollution is also wrong — agent jars belong in target/.
See Jib Docker Build § OTel javaagent for the full downloader + Jib XML.
3.3. Runtime config (application-otlp.yml)
spring:
  jpa:
    properties:
      hibernate.generate_statistics: true            # admin-service only — drop for non-JPA services

management:
  metrics:
    export:
      otlp:
        enabled: true

otel:
  java:
    global-autoconfigure:
      enabled: true
  exporter:
    otlp:
      endpoint: 'http://opentelemetry-collector.observability.svc.cluster.local:4318'
    jaeger:
      enabled: false
    zipkin:
      enabled: false
  springboot:
    resource:
      enable: true
  resource:
    attributes:
      'service.version': '${OTEL_SERVICE_VERSION:unknown}'
      'deployment.environment': '${OTEL_DEPLOYMENT_ENVIRONMENT:production}'
  instrumentation:
    annotations:
      enabled: true
    # logback-appender.enabled is deliberately NOT set — see Two-stream logging below
    spring-web.enabled: false
    spring-webmvc.enabled: false
    spring-webflux.enabled: false
Key decisions:
-
global-autoconfigure: true— picks up Spring Boot auto-config -
Jaeger and Zipkin exporters disabled — we only export OTLP to the collector
-
Resource attributes here apply to the Spring starter’s SDK only — they do not reach log records. See Resource attributes must go in
OTEL_RESOURCE_ATTRIBUTES`below. Never hard-code `deployment.environment: a literalproductionlabels dev and stage telemetry as production, and does so precisely when the agent has failed to attach and the fallback is in use -
Spring Web/WebMVC/WebFlux auto-instrumentation disabled — the javaagent already instruments these at bytecode level; keeping the Spring-SDK version enabled produces duplicate spans
-
logback-appender.enableddeliberately unset — the Jib flag-Dotel.instrumentation.logback-appender.enabled=falsedisables the agent’s duplicate capture, and Spring resolves system properties ahead of this file. The appender is installed fromOpenTelemetryLoggingConfiguration; see Two-stream logging
3.4. Resource attributes must go in OTEL_RESOURCE_ATTRIBUTES
deployment.environment, service.version and any other resource attribute that must appear on log records belongs in the OTEL_RESOURCE_ATTRIBUTES environment variable, set by the Helm chart. Declaring it under otel.resource.attributes in application-otlp.yml is not equivalent and will not work.
The reason is a direct consequence of the two-stream standard. OpenTelemetryLoggingConfiguration installs the Logback appender with GlobalOpenTelemetry.get(), which is the agent’s SDK. The agent builds its resource from OTEL_RESOURCE_ATTRIBUTES and OTEL_SERVICE_NAME. Attributes declared as Spring properties belong to the starter’s SDK — a different object — and never reach a log record.
This regressed silently in both services that adopted the standard first:
| Service | Version | deployment_environment on log records |
|---|---|---|
admin-portal |
|
Present — logs still went through the starter’s SDK |
admin-portal |
|
Absent — the install component moved log export to the agent’s SDK |
ems-mcp-server |
dev, pre- |
Present — the chart set |
ems-mcp-server |
stage |
Absent — the variable was removed while dropping |
It matters more once OTEL_SERVICE_NAME is environment-independent, which this standard requires: with no deployment.environment, dev, stage and prod records carry nothing that distinguishes them.
|
Do not set |
Keep the Spring-side declaration as well, sourced from the same environment variables. It governs metrics, and it is the resource in use if the agent ever fails to attach — the failure this standard exists to make visible.
# Helm chart — read by the agent, reaches log records
- name: OTEL_RESOURCE_ATTRIBUTES
  value: "deployment.environment={{ include "chart.otelDeploymentEnvironment" . }}"
- name: OTEL_DEPLOYMENT_ENVIRONMENT      # read by application-otlp.yml, Spring-side SDK
  value: {{ include "chart.otelDeploymentEnvironment" . | quote }}
Verify with a Loki query rather than by reading the chart — the failure is silent:
{service_name="<name>", exporter="OTLP"} # stream labels must include deployment_environment3.5. Javaagent at runtime
Jib bakes the javaagent at /javaagent/opentelemetry-javaagent.jar (the path is parameterised by the Maven properties agent-install-location and opentelemetry-javaagent-filename so it stays consistent across services). The container’s jvmFlags include:
<jvmFlag>-javaagent:${agent-install-location}/${opentelemetry-javaagent-filename}</jvmFlag>
<jvmFlag>-Dotel.logs.exporter=otlp</jvmFlag>
<jvmFlag>-Dotel.traces.exporter=otlp</jvmFlag>
<jvmFlag>-Dotel.metrics.exporter=otlp</jvmFlag>
Plus environment:
<environment>
    <OTEL_SERVICE_NAME>${project.artifactId}</OTEL_SERVICE_NAME>
</environment>
3.6. Exporter selection and OTEL_LOGS_EXPORTER
The exporter selectors (-Dotel.{logs,traces,metrics}.exporter=otlp) are set explicitly, and the Helm charts additionally set OTEL_LOGS_EXPORTER, OTEL_TRACES_EXPORTER and OTEL_METRICS_EXPORTER.
Neither is strictly required. Measured on agent 2.10.0: otlp is already the default for every signal — an agent with no exporter setting at all still constructs an OTLP log exporter and attempts to export. They are set anyway because the default is invisible. An operator reading a Helm chart cannot tell from silence whether logs ship, and that ambiguity is exactly how four of six services drifted into three different broken states without anyone noticing.
|
|
3.7. OTLP transport: HTTP/protobuf on port 4318
The EMS standard is OTLP over HTTP/protobuf on port 4318. Every service points at:
http://opentelemetry-collector.observability.svc.cluster.local:4318Port 4317 is OTLP gRPC. It requires OTEL_EXPORTER_OTLP_PROTOCOL=grpc in addition to the endpoint; without it the export fails with Connection reset and nothing ships at all — no traces, no logs, no metrics. That failure is silent from the application’s point of view and easy to misread as a missing exporter setting.
4318 is preferred over 4317 for three reasons:
-
It is the javaagent’s own default protocol in 2.x, so there is no second setting to remember or forget.
-
It is debuggable with ordinary HTTP tooling and legible through any proxy or ingress.
-
gRPC’s advantages — multiplexing, compression over long links — do not apply to an in-cluster collector at EMS volumes.
Revisit if the collector moves off-cluster or telemetry volume grows by an order of magnitude.
|
|
Customisation (sampling rate, instrumentation toggles, custom resource attributes) is done via env vars (OTEL_TRACES_SAMPLER=parentbased_traceidratio, OTEL_TRACES_SAMPLER_ARG=0.1, etc.) injected by the Helm chart from the ArgoCD valuesObject — not via an agent.properties file. The properties-file approach is supported by the agent but adds an extra config artefact for no benefit.
4. Per-service state
Measured 2026-08-23 against /proc/1/cmdline on each pod and Loki’s /series API. This supersedes the 2026-08-24 health-check table, which was wrong in two places.
| Service | Agent attached | OTLP logs | Notes |
|---|---|---|---|
|
yes |
yes |
Reference implementation of the two-stream standard (ADO-1009) |
|
yes |
yes |
Was believed broken; in fact exporting correctly. Adopted the standard in ADO-1012 |
|
dev only |
no |
stage and prod ran |
|
no |
no |
Carries |
|
no |
no |
Same shape as registration-portal. ADO-1011 |
|
n/a |
n/a |
Retired 2026-08-23 (ADO-1014). Deployment and ArgoCD application removed |
registration-portal and membership-ui have the environment variables but no agent, so they emit nothing over OTLP. Their console output still reaches Loki through the Alloy path described in the Overview.
4.1. Adding OTel to a service
Clone admin-service’s otlp profile config:
-
Same POM dependencies
-
Same
application-otlp.yml— exceptservice.versionadjusted per-service -
Same Jib extraDirectory for the javaagent
-
Same
jvmFlag -javaagent:${agent-install-location}/${opentelemetry-javaagent-filename}, resolving to/javaagent/opentelemetry-javaagent.jar
|
An earlier revision of this page told you to write Always use the Maven properties rather than a literal path. A hard-coded agent path that does not match the Jib |
Gateway-specific spans worth adding manually:
-
POST /api/session/tenant— wrap the token-exchange call in a span with attributesuser.sub,tenant.requested,tenant.current-before -
AdminServiceJwtRelayFilter— wrap the proxy call in a span withadmin-service.endpointattribute -
TenantResolutionFilter— a short span identifying the resolution source (domain/header/session)
These make debugging multi-tenant auth issues tractable in trace view.
5. Metrics
Micrometer + OTel bridge emit the standard JVM + HTTP + Hazelcast metrics. Additional EMS-custom metrics live in admin-service/src/main/java/…/config/MetricsConfiguration.java — OtlpMetricsNamingConvention keeps names dot-separated (OTel style) rather than underscore-separated (Prometheus style).
Selected metrics:
-
http.server.requests— rate, p95/p99 latency, status-code distribution per URI (automatic) -
jdbc.connections.active/jdbc.connections.max— HikariCP pool state -
hazelcast.partition.is-migrating— cluster rebalance indicator -
jvm.memory.used/jvm.gc.pause— standard JVM -
Custom:
ems.import.duration/ems.import.rows— import-specific timers, seeImportAsyncConfiguration
Dashboards live in the observability backend; owner: Solution Architect / Ops.
6. Tracing Patterns
6.1. Business-flow spans
Group multiple API calls that belong to the same user journey under a "business flow" span. See design-journal/2026-03/end-to-end-distributed-tracing.adoc for the design. Pattern:
@WithSpan("membership-registration")
public void registerMembership(...) {
    // child spans from auto-instrumented Spring Web + JDBC roll up under this
}
Useful for showing "registration took 3.4s" with breakdown across the participant, payment, and email sub-operations.
6.2. W3C traceparent propagation
Frontend → gateway → admin-service all propagate traceparent header. registration-portal’s interceptor (when OTel lands for it) should extract any existing trace from the browser’s performance-navigation entries and attach; otherwise generate a new root.
Cross-cluster propagation (e.g. admin-service → WordPress → RunSignup) honours the same convention where supported.
7. Two-stream logging
Services adopting the standard (ADO-1008) split logging by audience:
| Stream | Audience | Content |
|---|---|---|
Console (stdout) |
A Kubernetes operator with no domain knowledge |
Everything at |
OTLP |
A developer debugging behaviour |
Everything, with trace context and MDC as queryable attributes |
Console keeps WARN+ permanently. OTLP records are lost outright when the collector is unreachable, and a service that dies before the appender is installed never flushes its buffer — console is the fallback of last resort in exactly the cases that matter most.
The classification test for a reviewer: can a Kubernetes operator with no domain knowledge act on this line? If yes, it belongs on console.
Traces and metrics come from the agent; logs come from an explicitly declared OpenTelemetryAppender, because agent log capture happens at Logger.callAppenders, before appender routing, and therefore cannot be shaped by Logback filters or per-logger `appender-ref`s.
|
With both the agent’s Logback instrumentation and an explicit appender active, every statement is exported twice. The agent’s capture must be disabled with That same property name also gates the OpenTelemetry Spring Boot starter’s Do not set |
7.1. Conformance checklist
A logback-spring.xml adopting this standard must have all of the following. Each line is here because its absence has cost time in this estate.
| Requirement | Why |
|---|---|
Explicit |
Threshold is |
Explicit |
|
|
Business context must arrive as queryable attributes, not baked into the message string |
Root logger referencing both |
An appender that is configured but never referenced is silently inert |
Per-logger allowlist entries referencing |
Additivity is what keeps allowlisted records flowing to OTLP as well as console |
No |
See above — a rescan produces SDK-less appenders |
No file appender |
Container logs are collected from stdout; a file appender writes to a volume nothing reads |
|
Spring Boot rejects the nested form outright — |
Every appender declared in the same profile scope that references it |
A declared-but-unreferenced appender produces "Appender named [X] not referenced. Skipping further processing." An appender used only by |
No |
Tempting, and wrong. Logback’s status output (lines prefixed |
The two rules above were found together on 2026-08-23. Every EMS service had <springProfile> nested inside <root>; admin-service had carried a NopStatusListener since its original configuration, which is exactly why the invalid nesting went unnoticed for so long. Measured on ems-mcp-server, same boot command either side of the fix: 72 status lines before, 0 after.
Assert these in a unit test rather than trusting review. Every item fails silently in production: the application starts, serves traffic, and either stops exporting or exports twice, with no error and no failed probe. LogbackTwoStreamConfigurationTest in admin-service, admin-portal and ems-mcp-server parses the shipped file and asserts each rule.
Parsing the XML is necessary but not sufficient — it cannot distinguish a <springProfile> Spring Boot honours from one it declines. LogbackProfileWiringTest (ems-mcp-server) is the stronger check: it drives the shipped file through Spring Boot’s own SpringBootJoranConfigurator with profiles active and asserts what Logback actually built — [CONSOLE, OTLP] under otlp, [CONSOLE] without it, and no warnings under either. It lives in package org.springframework.boot.logging.logback because that configurator is package-private; a Spring Boot upgrade that moves it breaks compilation, which is the failure mode to prefer. Copy it into each service.
8. Logs-to-Traces Correlation
opentelemetry-logback-appender-1.0 emits every log record with the current trace and span IDs as structured fields. In Grafana, clicking a trace shows the correlated log lines.
Correlation works on the OTLP path only. An earlier revision of this page claimed the IDs also reach kubectl logs via %X{trace_id} / %X{span_id} in the console pattern. No EMS console pattern contained those tokens, so that was never true.
If you do want trace IDs on console, the agent’s Logback MDC instrumentation supplies them — but the keys are snake_case. Measured on agent 2.10.0 with an active span:
MDC = [trace_id=ceaf42e3…, trace_flags=01, span_id=16fee16e…]ems-mcp-server used %X{traceId:-} — camelCase — which matched nothing and rendered an empty column on every line it ever logged, failing silently because :- substitutes an empty string rather than raising. Corrected to %X{trace_id:-} in ADO-1013. Use trace_id and span_id.
9. Sampling
Current default: 100% (all traces exported). Low volume; backend handles it. When volume grows:
-
Head-based sampling at the collector — drop 90% of low-interest traces (health checks, readiness probes), keep 100% of error traces, keep high-percentage of slow traces.
-
Tail-based sampling — collector decides after collecting the full trace, based on total duration + error status.
Tune at the collector, not at the service. Services always emit; collector filters.
10. Known Gaps
Post-migration position, 2026-08-23.
-
registration-portal and membership-ui have no javaagent attached — both carry a complete set of
OTEL_*environment variables that nothing consumes, so neither produces traces, metrics or OTLP logs. ADO-1010 and ADO-1011. Their console output still reaches Loki via Alloy. -
ems-mcp-server is not yet verified end-to-end — stage and prod ran an image with no agent and were pointed at the gRPC port; both are corrected but unverified. The service is also silent when idle (56 stdout lines in 8 days), so verification requires generating traffic rather than merely deploying.
-
Frontend instrumentation — browser-originated OTLP proxied via gateway is designed (see
design-journal/2026-03/end-to-end-distributed-tracing.adoc) but not implemented. Adds browser-to-admin-service trace root. -
No SLO tracking — metrics exist but service-level objectives are not formalised. Future work.
Closed since the last revision: the ELK/Kibana backend is gone, replaced by in-cluster Loki, Tempo and Grafana; admin-ui is retired; the collector now has resource limits and terminates every signal inside the cluster.
|
A recurring lesson across all of the above: every failure mode in this page is silent. A missing agent, a hard-coded agent path, a gRPC port without a protocol variable, an appender with no SDK, a camelCase MDC key — none of them raise an error, fail a probe, or increment a counter. The service starts, serves traffic, and reports nothing. When verifying, never treat absence of errors as evidence. Check |
11. Reference
| File | Role |
|---|---|
|
OTel runtime config for admin-service |
|
Custom metrics registry + OTel bridge |
|
OTel-style naming convention |
|
Dependencies + javaagent download |
|
OTel Collector ArgoCD Application |
|
Cross-cutting tracing design including frontend |
13. Change History
| Date | Change |
|---|---|
2026-04-24 |
Initial draft. Grounded in |
2026-08-23 |
2026-08-23 |
Added the conformance checklist for |
2026-08-24 |
2026-08-24 |
Documented that resource attributes must travel in |
2026-08-23 |
2026-08-23 |
Reversed the |
2026-08-23 |