Observability Platform
1. Overview
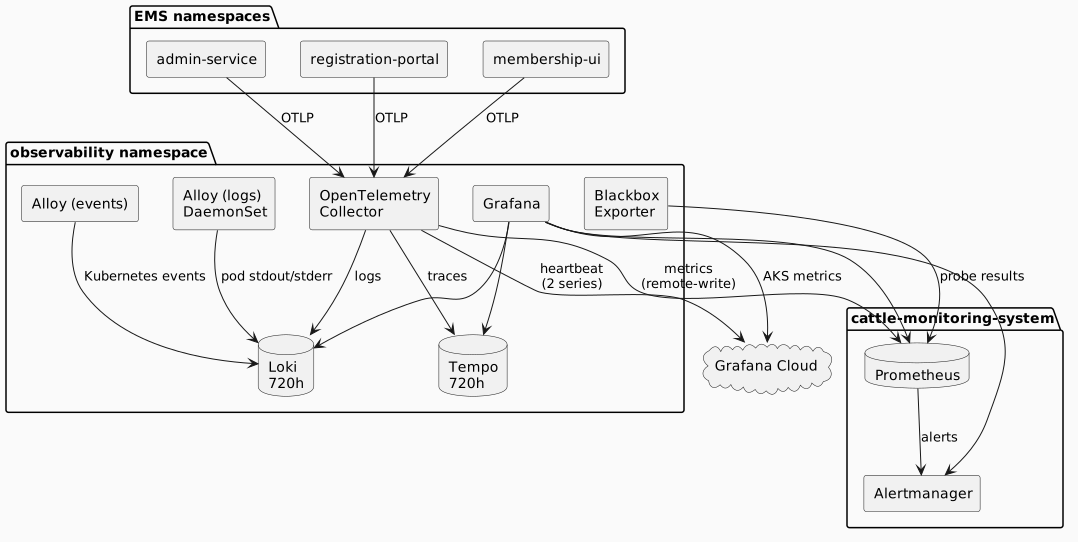
Every EMS service emits telemetry through OpenTelemetry to a central collector, which
fans the three signals out to a self-hosted Grafana stack running in the
observability namespace of the on-premises cluster. Traces land in Tempo, logs in
Loki, metrics in the Prometheus that Rancher already operates. One Grafana queries all
of them.
This replaced a paid Elastic Cloud backend in August 2026. The decision and the evidence behind it are recorded in ADR-0011; this page describes the design that resulted and how it is configured today.
Two pages sit either side of this one: OpenTelemetry Configuration covers how a service is wired to emit, and Observability Access covers how to read the result.
2. Why this shape
2.1. Vendor-neutral instrumentation, replaceable backends
Services are instrumented with OpenTelemetry and nothing else. No service knows that Loki, Tempo or Prometheus exist — each one exports OTLP to a single collector endpoint, and the collector decides where signals go.
This is the property that made the Elastic migration survivable. Replacing the entire backend changed collector configuration and Helm values; it changed no application code, and no service redeployed to make it happen. A backend the applications knew about would have made the same migration a coordinated release across every service.
2.2. One collector, not per-service integrations
All three signals converge on one OpenTelemetry Collector before they are routed. That gives a single place to apply sampling, filtering, noise suppression and label normalisation, and a single place to change when a destination changes.
It also concentrates risk, which is why the collector’s own health is one of the two things federated out of the cluster — see Watching the watchmen.
2.3. Self-hosted, on the cluster that produces the telemetry
The stack runs on the on-premises workload cluster, on Longhorn storage that was already paid for and largely unused. Telemetry does not leave the cluster in normal operation, retention is bounded by disk rather than by a billing tier, and there is no per-GB ingest charge to ration against.
The alternative — hosting the platform on the Azure management cluster — was measured and rejected: 24 GB of arm64 capacity already running at 147–175% memory overcommit, on per-GB billed Azure Disk. See ADR-0011.
2.4. Charts are mirrored, not consumed from upstream
Every component is deployed from a chart mirrored into an OCI registry under our own namespace, rather than pulled from the publisher’s repository:
source:
  repoURL: registry-1.docker.io
  chart: <our-namespace>/loki
  targetRevision: 7.3.0
Upstream chart repositories withdraw versions and occasionally disappear. Two ArgoCD applications elsewhere in the estate were found unmanageable in August 2026 for exactly those reasons — one pinned to a version the publisher had removed, one pointing at a repository that had begun returning 404. Mirroring means a rebuild does not depend on a third party still publishing what it published last year.
3. Signal flow
3.1. Traces
Services export OTLP traces to the collector. The trace pipeline filters known noise,
applies resource attributes, derives RED metrics through the spanmetrics connector,
and exports to Tempo.
The spanmetrics connector reads the span stream and emits RED metrics — the three
service-level measures that answer "is this service healthy?" without knowing anything
about what it does:
| Signal | What it measures |
|---|---|
*R*ate |
Requests per second reaching the service, from the count of spans over time. Answers "is it being used, and has the load changed?" |
*E*rrors |
The proportion of those requests that failed, from the span status. Answers "is it failing, and what share of traffic is affected?" — a rate rather than a count, because ten failures out of ten matters differently from ten out of ten thousand. |
*D*uration |
How long requests take, as a latency distribution rather than an average. Answers "is it slow?" — and percentiles matter here, because a mean hides the tail where the complaints come from. |
RED is the request-driven counterpart to USE (Utilisation, Saturation, Errors), which
describes resources — CPU, memory, disk. Both are collected here: RED from the trace
stream for services, USE from kube-state-metrics and node exporters for the cluster.
spanmetrics is also the reason no EMS service has a ServiceMonitor. All three
measures are derived from the trace stream the services already emit; scraping Actuator
as well would land the same measurements a second time under a different label set, at
additional cardinality cost.
3.2. Logs — two independent paths
Logs reach Loki two ways, and the distinction matters when a query comes back empty:
| Path | What it carries | Notes |
|---|---|---|
OTLP — service → collector → Loki |
Application logs from the Logback OTel appender, as structured records carrying
|
Correlates with traces. Grafana’s Loki datasource turns a |
Alloy DaemonSet — |
Whatever the container writes to stdout and stderr, from every pod on the node |
Independent of the collector, so it still works if the collector is down. Carries no MDC trace fields, so the trace link does not appear on this path. |
The second path is stdout and stderr only. A container writing its real log to a file inside its own filesystem is invisible to it regardless of how correct the query is — a failure mode that has already cost debugging time on the SSH bastion.
A second Alloy instance ships Kubernetes events to Loki, labelled to distinguish them from pod logs.
3.3. Metrics
The collector remote-writes OTLP metrics into the Prometheus that Rancher monitoring already operates, rather than introducing Mimir or a second Prometheus. That instance already held a quarter of a million active series with working retention; enabling its remote-write receiver restored the metrics pipeline without adding a component.
Blackbox Exporter probes the estate’s public endpoints from inside the cluster, with the
probe list held as Probe custom resources under GitOps.
4. Watching the watchmen
A self-hosted stack cannot report its own death. If the cluster, the collector or Alertmanager stops, everything goes quiet — and quiet is indistinguishable from healthy.
The mitigation deliberately costs no infrastructure. A dedicated collector pipeline federates exactly two stable series from the in-cluster Prometheus to Grafana Cloud’s free tier:
-
ALERTS{alertname="Watchdog"}— proves Prometheus is evaluating rules -
alertmanager_build_info— proves Alertmanager is up and being scraped
Two Grafana Cloud alert rules then fire on the absence of those series. Detection therefore lives outside the failure domain being watched, which is the whole point.
Three details are deliberate rather than incidental:
-
The heartbeat is its own pipeline, kept separate from application metrics, so that backpressure from telemetry volume cannot drop it and application telemetry cannot reach Grafana Cloud.
-
Per-pod labels are dropped before remote-write. Two stable series is the entire budget; a label that changes on every pod restart turns two series into hundreds and exhausts a free-tier quota.
-
alertmanager_build_infocarries the liveness signal rather thanup, because the Prometheus receiver synthesises its ownupper scrape and a federated metric of the same name collides with it, failing the scrape wholesale while/federatestill returns HTTP 200.
4.1. Where the probes watch from
Blackbox Exporter runs inside the cluster it probes. It resolves the public hostname and follows it back to the ingress, so it verifies that the ingress, the service and the application behind it are answering — but the request never leaves the estate’s network.
That leaves a specific blind spot: the cluster is healthy and reporting, and the site is still unreachable from the internet. DNS, the upstream network, or a certificate as seen by an outside client can all fail while every in-cluster probe stays green.
Observation therefore runs in three layers, each catching what the others cannot:
| Layer | Catches | Where it runs |
|---|---|---|
In-cluster probes |
Ingress, service and application faults — is the thing behind the hostname answering |
Blackbox Exporter with |
External probes |
DNS, upstream network, externally-visible certificate problems — is it reachable from outside |
Alloy’s embedded blackbox exporter on the Azure cluster, results to Grafana Cloud |
Absence detection |
Total loss: cluster, Prometheus, Alertmanager, the collector or the external prober gone |
Grafana Cloud, on federated heartbeat series |
4.2. The external layer
Alloy on the Azure cluster probes a representative set of the estate’s public endpoints from Azure East US — a different region and a different network path — and writes the results to Grafana Cloud.
Three properties are deliberate:
-
It reuses Alloy rather than deploying a prober. Alloy embeds
blackbox_exporter, so the whole layer is a configuration block: no extra image (the Azure nodes are arm64), no Prometheus Operator CRDs, and it rides the remote-write to Grafana Cloud that was already wired for that cluster’s metrics. -
It alerts in Grafana Cloud, not in the workload cluster’s Alertmanager. An outage that takes out the cluster must not also take out the alert about it — the same reasoning that placed the dead-man’s switch there.
-
It probes every customer-facing hostname, not one per service. The services are multi-tenant and each tenant is reached at its own alias — the registration portal alone answers on
registration,wcsc,hnrandhnr-vc(v1) plusregistration-v2,wcsc-v2andmembers(v2). Each alias carries its own DNS record and its own certificate, so probing one proves nothing about the others: a tenant can be dark on an expired certificate or a missing record while the host the probe happened to pick stays green. Per-host probing is what makesprobe_ssl_earliest_cert_expiryandprobe_dns_lookup_time_secondsmean anything. Eighteen targets, production only — dev, stage and internal tooling are excluded because they are not customer-facing.
One target needs a non-default check. mcp.idealogic.co.za is OAuth-protected and returns
401 at its root, so it is probed with a module that accepts 401 alongside 2xx. A
401 there has already proved DNS, TLS and liveness; treating it as a failure would have
meant a permanently firing alert.
When an external probe fails, the first diagnostic is the in-cluster probe for the same endpoint. If that one is still passing, the fault is in the path to the cluster rather than in the application behind it — which is precisely the distinction the layer exists to make.
A further rule watches for the external results stopping altogether, because a lost vantage point is otherwise indistinguishable from a healthy estate. That is the same silent-failure shape the heartbeat rules address, so it sits in the same group.
5. Component configuration
As deployed in the observability namespace, unless noted. Chart versions move; treat
this table as the shape rather than the current pin, and read the ArgoCD applications in
the cluster GitOps repository for authoritative values.
| Component | Configuration |
|---|---|
Loki |
Single-binary deployment, one replica, filesystem storage on a 200 GiB Longhorn volume.
Retention enabled at |
Tempo |
Single instance, OTLP receiver, |
Grafana |
Entra ID (Azure AD) sign-in with open self-provisioning at the |
OpenTelemetry Collector |
Four pipelines — traces to Tempo, metrics by remote-write to Prometheus, logs to Loki,
and the isolated heartbeat to Grafana Cloud. Memory ceilings are nested so the
container limit sits above the collector’s own |
Alloy (logs) |
DaemonSet; each member tails only pods scheduled on its own node. Applies CRI parsing, drops known probe noise, joins multi-line Java stack traces into single entries for the EMS namespaces, and attaches severity as structured metadata rather than a stream label — a level label would multiply stream cardinality by its value count for no query benefit. |
Alloy (events) |
Deployment; ships Kubernetes events to Loki under a distinguishing |
Prometheus + Alertmanager |
Rancher-managed, in |
Blackbox Exporter |
HTTP probes against public endpoints, driven by |
5.1. Alert routing
Alerts are Prometheus- and Alertmanager-managed; Grafana’s own unified alerting holds no
rules. Routing is first-match, with info and none severities routed to a null
receiver — on a three-node estate they are noise — and inhibition rules written only
where both alerts genuinely share a join label. A rule whose equal labels are absent
on one side never fires and looks identical to one that has simply had no cause to.
Note that a rule engine other than Prometheus — the Loki ruler, for instance — reaches
Alertmanager directly and never appears in Prometheus’s ALERTS metric. Anything
counting alerts from ALERTS alone will under-report. See
Observability Access.
6. The second cluster
The Azure cluster that hosts Rancher ships metrics only, through the
k8s-monitoring chart, to Grafana Cloud’s free tier — not to the self-hosted stack. No
logs, no traces.
It also carries the external probes described above, which is the one place it observes the other cluster rather than itself.
That is a cost decision, not an oversight: AKS log volume would dwarf the free tier, and the question that cluster has to answer is narrow — is Rancher up, is ArgoCD syncing, are the nodes under pressure, is cert-manager renewing. The series budget is scoped hard against a 10,000-series ceiling and measured against Grafana Cloud rather than estimated from the agent’s own WAL counters, which over-report.
The practical consequence for anyone querying: an empty Loki result for an Azure workload is correct behaviour. Only the on-premises cluster’s logs reach Loki.
7. Deliberately not built
| Not adopted | Why |
|---|---|
A |
|
Mimir, or a second Prometheus |
The existing Rancher Prometheus had working retention and capacity. Enabling its remote-write receiver solved the metrics gap without a new component. |
A dedicated alert UI (Karma) |
Grafana’s Alertmanager datasource provides alert listing and silence management in a UI already deployed and already behind Entra sign-in. A second tool would mean a second authentication surface for a subset of the same function. |
On-call scheduling (GoAlert) |
Its value is rota mechanics — escalation, acknowledgement, hand-over — against what is currently a single-operator estate. The problem-list need is met by a dashboard. |
Migrating Rancher’s bundled dashboards |
They are chart-owned and regenerate on every upgrade. The upstream kubernetes-mixin set is declared as labelled ConfigMaps instead, so it stays current and under GitOps; copying them would create a fork that goes stale silently. |
8. Related Documentation
-
ADR-0011 — the decision to leave Elastic Cloud and self-host
-
OpenTelemetry Configuration — how a service is wired to emit
-
Observability Access — how to query the result
-
Microservice Pattern — the service baseline that includes OTel instrumentation
-
ArgoCD Deployment Patterns — how these components are deployed and troubleshot